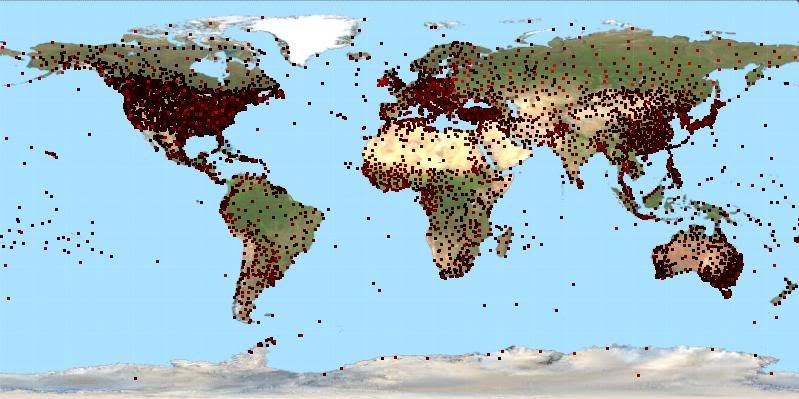
The color difference is so slight and my jpgs get distorted so much it's not a particularly viewable graph. Also the dots overlap each other, especially in the US. When that happens the brighter dots win as they are drawn over the top of the darker dots. If this mattered for anything other than curiosity I would perhaps plot separate maps for each level.
It does appear even from this bad graphic that some regions of the world have stations with a lot of duplicates while other regions have stations with far fewer duplicates. Not surprising I suppose.
The numbers I got for raw records are:
1 record = 4574 stations
2 records = 1109 stations
3 records = 601 stations
4 records = 502 stations
5 records = 271 stations
6 records = 114 stations
7 records = 57 stations
8 records = 39 stations
9 records = 11 stations
10 records = 2 stations (Irkutsk and Los Angeles for what it's worth)
It's not possible to have 11 duplicates in the file as the duplicates column is a single digit..
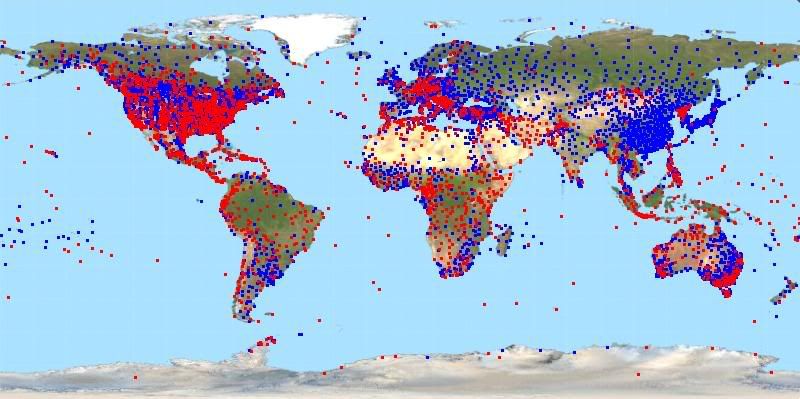
The numbers I got for adjusted records are:
0 records = 2509 stations (that's right, a lot of stations appear to only have raw data)
1 record = 3556 stations
2 records = 752 stations
3 records = 275 stations
4 records = 110 stations
5 records = 58 stations
6 records = 18 stations
7 records = 2 stations (Irkutsk again! and Sverdlovsk..wherever that is, I only know irkutsk from playing risk)
The graph this time is a bit more viewable. I plotted all stations with at least one adjusted record in blue and then over the top I plotted all stations with no adjusted records in red.
Today I compiled and store away station meta-data like number of raw and adjusted duplicates (which I used in this post) as well as the start and end dates of each record. I also have scope to add more such meta-data later. By "storing it away" I mean I have separated this info from the temperature data itself so I can load that information without loading all the actual temperature data. Will make queries on those things faster. Of course if I download an updated copy of the GHCN files I need to refresh the metadata files, but that's an infrequent task.
Next I need to add the ability to calculate linear trends over arbitrary periods. I also need to figure out how to handle duplicates in any analysis. Do I average them? Take a random duplicate? Exclude outliers? My thoughts are to try them all and see what difference it makes as I have no knowledge or basis to pick a particular strategy.
No comments:
Post a Comment